
- Brand
- Unknown
- Category
- Pending
- Primary Subcategory
- Pending
Integration details
Description
MerchantSpring is the marketplace analytics platform built for agencies and enterprise brands, unifying sales, profit, advertising, inventory, traffic, Buy Box, and customer performance across seller and vendor accounts on 120+ marketplaces including Amazon, Walmart, eBay, Shopify, and more. ChatGPT pulls live, portfolio-wide metrics with period-on-period comparisons built in. Drill from the total portfolio down to a single store or SKU, covering sales trends, store and product-level profit and loss, advertising performance by channel, and on-demand report types spanning inventory health, Buy Box performance, traffic and conversion, customer lifetime value, refunds, repeat purchase and more. Ask things like "Compare sales across all client marketplaces this month vs last", "Which SKUs ran negative margins last quarter?", "How did advertising performance shift across channels week on week?", or "Show ordered vs shipped revenue for our Amazon Vendor accounts by month". ChatGPT fetches the live numbers and does the analysis on the spot. For agencies, that means the whole client book in one conversation - filter any query by marketplace, country, or store tags, compare performance across every account you manage, and turn the answers straight into client-ready reporting. Seller and vendor accounts are both fully supported. Trusted by 35,000+ brands and agencies.
- Integration type
- Plugin
- Verification status
- Not applicable
- Platform
- ChatGPT
- Category
- Pending
- Primary Subcategory
- Pending
- Secondary Subcategories
- None listed
- Brand
- Unknown
- Access
- Account required
- First tracked
- 2026-10-15
- Tool count
- 25
- Geography
- US
The broad Category that contains the Primary Subcategory.
The Primary Subcategory used for this profile’s headline score.
Other Subcategories where the Integration is listed.
 Agent Discoverability
 ChatGPT Plugin Discovery Score
Your score is coming
ChatGPT now suggests Plugins on its own when they match a user's request.Your Plugin Discovery Score measures how often yours appears, and it will show here as soon as it’s ready.
What discovery looks like
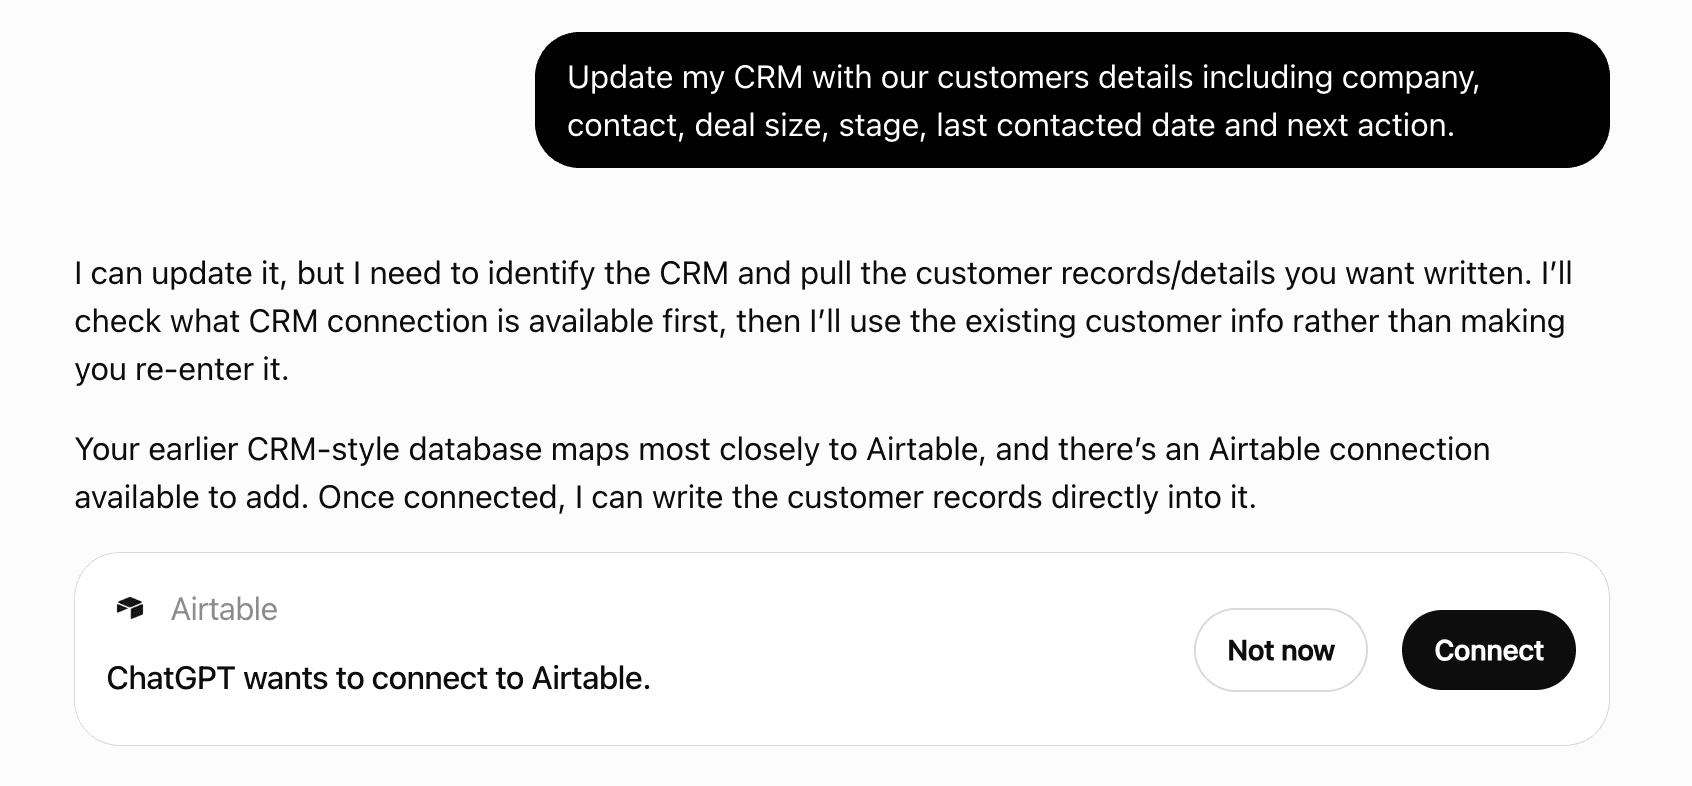
Get alerts for MerchantSpring
Get updates when MerchantSpring’s Discoverability Score or category rank changes.
Competitive lineup
25 tools agents can invoke
Convert between human-readable dates and Unix epoch timestamps, generate date ranges for reports, and create comparison periods. Supports various timezones and predefined periods. Important: Always use this tool to get the most accurate timestamp for 'from' and 'to' date calculation before any tool for retrieving reports
calculateDateEpoch
Create a new custom product group for a merchant store. What it does: Creates a named group and optionally seeds it with an initial list of products (by sellerSku). Groups organize products for analytics. Group names must be unique per store. For brand-based groups use createGroupByBrands instead. When to use this tool — example user queries: - "create a group called Summer Products on store X" - "make a new product group with SKUs A, B, C" - "set up a custom group for my top sellers" - "add a group named Seasonal Items to my Amazon store" Routing & params: - channelId, merchantId: required — use getChannels tool first to retrieve valid values. - groupName: required — unique name for this store; blank names are rejected. - products: optional list of {sellerSku} items to add at creation time.
createGroup
Create a new custom brand group for a merchant store. What it does: Creates a brand-filtered group from a list of brand name strings. Brand groups differ from product groups — they aggregate by brand rather than by SKU. Use updateGroup to rename or modify brand membership. For SKU-based groups use createGroup instead. When to use this tool — example user queries: - "create a group for all Nike and Adidas products" - "make a brand group called Sports Brands with Nike, Adidas, Puma" - "group all my Nike products together by brand" - "create a brand-based group on store X" Routing & params: - channelId, merchantId: required — use getChannels tool first to retrieve valid values. - groupName: required — unique name for this store. - brands: required non-empty list of brand name strings.
createGroupByBrands
Delete a custom group from a merchant store. Permanent and irreversible. What it does: Permanently removes the group and all its product/brand assignments. The group no longer appears in analytics tools. This cannot be undone. When to use this tool — example user queries: - "delete the group called Summer Products" - "remove the test group from store X" - "I want to delete group ID 42 named Old Campaign" - "clean up the unused groups on my store" Routing & params: - channelId, merchantId: required — use getChannels tool first to retrieve valid values. - groupId: required integer — from getCustomGroups. - confirmGroupName: required — the exact group name as returned by getCustomGroups. The server cross-checks this against the groupId before issuing the delete; a mismatch returns an error without deleting anything. Always call getCustomGroups first to obtain the exact name and groupId. - confirm: omit on the first call; re-call with confirm: true to proceed.
deleteGroup
Generate any type of report for a channel and merchant. Use getChannels tool first to retrieve valid channelId and merchantId values. Use the report_type parameter to select the report: - campaigns: Advertising campaigns performance - cancellationsAndRefunds: Order cancellations and refund metrics - channelProfitAndLoss: Channel-level profit and loss statement. Single-window: the CSV always covers the requested fromDate/toDate only, so priorFromDate/priorToDate are ignored. Defaults to settled (cash-basis) figures — pass profitabilityView: 'accrual' to reconcile against order-date sales data. - customerLifetimeValue: Customer lifetime value analysis - inventoryHealth: Inventory health and stock levels (Amazon vendor channels only) - inventoryReplenishment: Inventory replenishment recommendations (Amazon seller channels only; no date range required) - marketingByProduct: Marketing spend and performance broken down by product - orderedRevenue: Vendor ordered revenue (Amazon vendor channels only) - products: Product catalogue details — Enterprise only (requires skus[], no date range) - repeatPurchase: Repeat purchase rate and customer retention - salesByProduct: Sales metrics broken down by product - shippedRevenue: Vendor shipped revenue (Amazon vendor channels only; requires view: shipping|manufacturing) - subscribeAndSave: Subscribe & Save subscription metrics - suppressedProduct: Suppressed product listings (no date range required) - trafficAndConversion: Traffic and conversion rate metrics (requires view: 'parents'|'skus') - amazonBuyBoxPerformance: Amazon Buy Box performance (requires filter, no date range) A channelProfitAndLoss report always covers the requested fromDate/toDate window only; priorFromDate/priorToDate are not sent for it and no comparison window appears in the file. After generating a report, use getReportStatus to poll for completion and retrieve the download URL. Then use readSummarizedReport to analyse the downloaded report.
generateReport
List advertising ad group performance across one or more channels. What it does: Returns ad-group-level advertising performance (impressions, clicks, cost, attributed sales, ACOS, ROAS, etc.) for the given channels and date range, optionally scoped to specific campaigns. When to use this tool — example user queries: - "list the ad groups under campaign 10012" - "what ad groups are running on my store this month?" Routing & params: - channelId: required — use getChannels tool first to retrieve valid values (1-5 channels). Skip any channel with 'hasAdvertisingConnected: false' — it has no advertising connection and this tool will reject it. - fromDate, toDate: required, unix epoch seconds. Server enforces a maximum date range of 6 months. - campaignId: optional — filter to specific campaign IDs (up to 10). Use getAdvertisingCampaigns first to find IDs. - pageIndex, pageSize, sortKey, sortOrder, currency, status: optional refinements.
getAdvertisingAdGroups
List advertising campaign performance across one or more channels. What it does: Returns campaign-level advertising performance (impressions, clicks, cost, attributed sales, ACOS, ROAS, etc.) for the given channels and date range, merged across channels into a single paginated list. When to use this tool — example user queries: - "show me my ad campaigns for the last 30 days" - "what's the ACOS on my campaigns this month?" - "list active campaigns for my Amazon store" Routing & params: - channelId: required — use getChannels tool first to retrieve valid values (1-5 channels). Skip any channel with 'hasAdvertisingConnected: false' — it has no advertising connection and this tool will reject it. - fromDate, toDate: required, unix epoch seconds. Server enforces a maximum date range of 6 months. - groupId: optional — filter by custom campaign group IDs (from getCustomGroups). - pageIndex, pageSize, sortKey, sortOrder, currency, status: optional refinements.
getAdvertisingCampaigns
List advertising keyword performance across one or more channels. What it does: Returns keyword-level advertising performance (impressions, clicks, cost, attributed sales, ACOS, ROAS, etc.) for the given channels and date range, optionally scoped to specific campaigns or ad groups. When to use this tool — example user queries: - "what keywords are running in ad group 20031?" - "show me my top performing keywords this month" Routing & params: - channelId: required — use getChannels tool first to retrieve valid values (1-5 channels). Skip any channel with 'hasAdvertisingConnected: false' — it has no advertising connection and this tool will reject it. - fromDate, toDate: required, unix epoch seconds. Server enforces a maximum date range of 6 months. - campaignId, adGroupId: optional — filter to specific campaign/ad group IDs (up to 10 each). Use getAdvertisingCampaigns/getAdvertisingAdGroups first to find IDs. - pageIndex, pageSize, sortKey, sortOrder, currency, status: optional refinements.
getAdvertisingKeywords
Retrieve advertising performance metrics for all channels with configurable reporting periods and comparison analysis. Supports filtering, pagination, sorting, and returns time-based advertising data with current vs prior period comparisons. Returns direct JSON data without AI summarization. Each period (fromDate to toDate, and priorFromDate to priorToDate) may cover at most 31 calendar days in the report timezone, so one full calendar month fits in one call.
getAdvertisingByChannels
List advertised product performance across one or more channels. What it does: Returns product-level advertising performance (impressions, clicks, cost, attributed sales, ACOS, ROAS, product_title, image_url, link_url, etc.) for the given channels and date range, optionally scoped to specific product SKUs. The title/image/link fields make this the right tool when the user wants customer-facing product visuals alongside ad metrics. When to use this tool — example user queries: - "show me advertised product performance for SKU B00ABCDEF1" - "which products are getting the most ad spend?" - "show me the top products with their images" Routing & params: - channelId: required — use getChannels tool first to retrieve valid values (1-5 channels). Skip any channel with 'hasAdvertisingConnected: false' — it has no advertising connection and this tool will reject it. - fromDate, toDate: required, unix epoch seconds. Server enforces a maximum date range of 6 months. - productSku: optional — filter to specific product SKUs (up to 10). - pageIndex, pageSize, sortKey, sortOrder, currency, status: optional refinements.
getAdvertisingProducts
Retrieve Amazon catalog attributes for a single ASIN on a seller or vendor channel. What it does: Returns catalog data for the given ASIN — item summary, catalog attributes (brand, bullet points, item name), identifiers (UPC/EAN/etc.), images, sales ranks, classifications, product types, variation/package relationships, and either seller listing data (offers, fulfillment availability, issues, SKU, status) or vendor listing data (vendor details), depending on the channel type. Seller-specific fields are null for vendor channels and vice versa. When to use this tool — example user queries: - "show me the catalog attributes for ASIN B0020MMCJI" - "what's the Amazon listing status for this product?" - "what images and bullet points does Amazon have for this ASIN?" - "show me the product attributes and catalog details for this ASIN" Routing & params: - channelId, merchantId: required — use getChannels tool first to retrieve valid values. Must be an Amazon seller or vendor channel; the request is rejected for non-Amazon channels. - asin: required, exactly 10 letters/numbers (e.g. 'B0020MMCJI').
getAmazonProductAttributes
List all connected stores/channels for the account, returning channelId and merchantId for each — the foundational lookup needed before calling most other MerchantSpring tools. Call this first whenever another tool requires channelId or merchantId and you don't already have them. When to use this tool — example user queries: - "list my stores" - "what channels are connected to my account?" - "find my Amazon store" / "look up channel id for Liquid Vault" - "resolve merchant id for a store" - "what marketplaces/channels do I have?" Routing & params: - marketplaces: optional filter (amazon, ebay, shopify, walmart, amazon_vendor, etc.). - countryCodes: optional ISO 3166-1 alpha-3 filter (e.g. USA, GBR, AUS). - Leave both empty to retrieve all channels for the account. - Each channel has a `hasAdvertisingConnected` flag. Before calling any advertising tool (getAdvertisingCampaigns, getAdvertisingAdGroups, getAdvertisingKeywords, getAdvertisingProducts) with a channelId, skip channels where this is false — they have no advertising connection and those tools will reject them.
getChannels
List all custom groups for a merchant store. What it does: Returns all custom product and brand groups configured for a given merchant store (mid). Groups are merchant-scoped — a groupId from one mid cannot be used with another. Use the returned groupIds when calling createGroup, updateGroup, or deleteGroup. When to use this tool — example user queries: - "show me the groups for store X" - "what custom groups do I have?" - "list the product groups on my Amazon store" - "get the group IDs for my merchant" Routing & params: - channelId, merchantId: required — use getChannels tool first to retrieve valid values. - pageIndex, pageSize: optional pagination (defaults fetch the max page size of 100). If a store has more than 100 groups, increase pageIndex to see the rest.
getCustomGroups
Check the status of an updateDirectCosts job. Use this to poll for completion after calling updateDirectCosts. jobStatus is one of IN_PROGRESS, COMPLETED, or FAILED.
getDirectCostsJobStatus
Fetch P&L for a channel/merchant and date range (epoch seconds). Defaults to profitabilityView 'settled' (cash-basis, driven by settlement timing), which will not tie out against the order-date figures returned by the sales tools over the same window. Pass profitabilityView: 'accrual' whenever comparing or reconciling this P&L against sales figures.
getProductProfitAndLoss
Check the status of any generated report. Use this to poll for completion after generating any type of report. Use getChannels tool first to retrieve valid channelId and merchantId values. A status of `errored` is terminal and can mean either invalid report parameters (e.g. an unsupported reportOptions value such as a bad `view`) or genuinely no data for the requested window — it is not necessarily a generation failure. If you just introduced or changed a parameter, suspect that parameter (re-check its enumerated values) before concluding the channel has no data.
getReportStatus
[IMMEDIATE] Returns sales performance metrics for all channels as JSON instantly — no polling required. Supports time-based comparisons, filtering, pagination, and sorting, and returns direct JSON data without AI summarization. Monetary values, including sales, forecastTarget, budgetTarget, and avOrderValue, are always returned in USD for cross-channel comparison. Report them as USD. This tool does not return the original native-currency amount or exchange rate, so do not attempt an exact native-currency conversion; explain that MerchantSpring dashboards may display the marketplace's native currency instead.
getSalesByChannels
[IMMEDIATE] Returns paginated JSON data instantly — no polling required. For product-level sales, prefer this over generateReport with report_type 'salesByProduct', which returns a downloadable file you must poll for. Best for interactive queries, browsing, filtering, and product-level sales lookup with pagination and search. Retrieve paginated sales performance data by product with current and prior period comparisons. Returns direct JSON data including rows and total count. Use getChannels tool first to retrieve valid channelId and merchantId values.
getSalesByProduct
[IMMEDIATE] Returns JSON time-series data instantly — no polling required. Best for dashboards, trend analysis, and quick queries aggregated by time buckets (daily/weekly/monthly/etc). NOT for product-level breakdown. Retrieve time-series sales performance metrics for a specific channel with configurable time periods and intervals. Returns bucketed data (year/quarter/month/week/day/hour) with current vs prior period comparisons for the specified date ranges. No pagination - returns all time periods within the specified range. Use getChannels tool first to retrieve valid channelId and merchantId values.
getSalesByPeriod
Fetch P&L for a channel/merchant and date range (epoch seconds). Defaults to profitabilityView 'settled' (cash-basis, driven by settlement timing), which will not tie out against the order-date figures returned by the sales tools over the same window. Pass profitabilityView: 'accrual' whenever comparing or reconciling this P&L against sales figures.
getStoreProfitAndLoss
[IMMEDIATE] Returns one wide row per ASIN instantly — no polling required. Vendor only. Each row combines every data point held for the product: catalogue, ordered revenue, shipped revenue (sourcing and manufacturing), inventory health, purchase orders, product profit, sourcing share and advertising. Supply asin to fetch a single product, or omit it to page through the full master list (products with sales activity in the window). The date range must not exceed 31 calendar days. Page size defaults to 20 and is capped at 50 (rows are wide). Uses zero-based page indexing. Use getChannels tool first to retrieve valid channelId and merchantId values, filtering by marketplace filters `amazon_vendor` and `amazon_vendor_filtered`.
getVendorAsins
Retrieve time-series vendor sales performance metrics for a vendor specific channel with configurable time periods and intervals. Returns bucketed data (year/quarter/month/week/day/hour) with current vs prior period comparisons including vendor-specific metrics like ordered revenue, shipped revenue, COGS, manufacturing data, and advertising performance. No pagination - returns all time periods within the specified range. This report works ONLY for VENDORS. Use getChannels tool first to retrieve valid channelId and merchantId values, filtering by marketplace filters `amazon_vendor` and `amazon_vendor_filtered`
getVendorSalesByPeriod
Download and AI-summarize a completed report to provide insights. Use after generateReport → getReportStatus reports status 'done'. Pass the reportId (plus channelId and merchantId) — the server resolves the report's download location itself, so you never handle the S3 URL.
readSummarizedReport
Render one complete final MerchantSpring report from a structured spec. Call this tool exactly once with the final spec. AVAILABLE COMPONENTS (24): - Card: { title?: string, description?: string, className?: string, badge?: string, tooltip?: string } - Branded MerchantSpring card. A titled content container with a header (title + optional subtitle) and a divider, matching the platform's widget cards. Put charts, KPI grids, or tables inside. Omit `title` for a plain bordered container. `badge` adds a status pill next to the title; `tooltip` shows an info icon with a hover tip. [accepts children] - Grid: { columns?: number, gap?: "sm" | "md" | "lg" | "xl", className?: string } - Responsive grid container. `columns` (1-6) is the max columns on a wide card; it collapses to fewer as the card narrows (container-query responsive). `columns: 1` is a full-width row, NOT a narrow cell — required for funnel charts and the report header, and recommended for most charts. `columns: 2` is only for intentional side-by-side direct comparisons between max-2 charts such as line, bar, or combo charts. Columns 3-4 are for KPI tiles (`MSStatCard`) only; 5-6 only for tiny badge/text tiles. Do NOT mix full-width charts and KPI tiles in one Grid — use separate Grids stacked vertically. Column limits: each component's LAYOUT note states its max; the renderer clamps `columns` to the strictest child limit. [accepts children] - Stack: { direction?: "horizontal" | "vertical", gap?: "none" | "sm" | "md" | "lg" | "xl", align?: "start" | "center" | "end" | "stretch", justify?: "start" | "center" | "end" | "between" | "around", className?: string } - Flex stack. `direction` vertical (default) stacks children top-to-bottom; horizontal lays them in a row that wraps and collapses to a column as space narrows. `gap`/`align`/`justify` control spacing and alignment. [accepts children] - Separator: { orientation?: "horizontal" | "vertical" } - A thin divider line between sections. `orientation` horizontal (default) or vertical. - Heading: { text: string, level?: "h1" | "h2" | "h3" | "h4", tone?: "default" | "primary" | "secondary" | "info" | "success" | "warning" | "danger" | "muted" } - A section heading. `level` h1-h4 sets size/weight (defaults h2). `tone` colours the text (info/success/warning/danger/etc.). - Text: { text: string, variant?: "caption" | "body" | "muted" | "lead" | "code", tone?: "default" | "primary" | "secondary" | "info" | "success" | "warning" | "danger" | "muted" } - A paragraph of text. `variant` styles it: body (default), caption (small), muted (grey), lead (large intro), or code (monospace). `tone` colours the text (info/success/warning/danger/etc.); ignored for the `code` variant. - Badge: { text: string, variant?: "default" | "secondary" | "destructive" | "outline", tone?: "default" | "primary" | "secondary" | "info" | "success" | "warning" | "danger" | "muted" } - A small status pill. `variant` default/secondary/destructive/outline. `tone` gives a branded info/success/warning/danger/etc. pill; overrides `variant` when set. - Alert: { title: string, message?: string, type?: "success" | "info" | "warning" | "error" } - A compact, single-line status callout — NOT a section title, header, or long-form note. `type` success/info/warning/error sets the colour. Put the short one-liner in `title` (required), adding a leading emoji/icon for emphasis as needed; leave `message` empty or to a brief second clause, never a paragraph. LAYOUT: full-width row recommended; may share a 2-column Grid for direct comparison. - Table: { columns: Array<string | { header: string, align?: "left" | "center" | "right", numeric?: boolean }>, rows: Array<Array<string>>, caption?: string, footerRow?: Array<string>, striped?: boolean } - A simple data table from `columns` (label strings or `{header, align?, numeric?}` objects) and `rows` (string cell arrays). A `numeric` column right-aligns and uses tabular number spacing. `footerRow` renders a totals/summary row at the bottom. `striped` applies zebra-striping to even rows. Optional `caption`. LAYOUT: full-width row recommended; may share a 2-column Grid for direct comparison. - MSLineChart: { title?: string, xKey: string, period?: "TODAY" | "YESTERDAY" | "WTD" | "WTDMTS" | "LAST30" | "MTD" | "CURRENTMONTH" | "LASTMONTH" | "CURRENTQ" | "LASTQ" | "LAST12" | "YTD" | "CURRENTYEAR" | "CUSTOM", currency?: string, palette?: "categorical" | "ranked" | "warm" | "cool" | "semantic", series: Array<{ key: string, label: string, tone?: "default" | "primary" | "secondary" | "info" | "success" | "warning" | "danger" | "muted", color?: string }>, data: Array<Record<string, number | string | unknown>> } - MerchantSpring line chart. Plots a SINGLE metric line over a numeric unix-seconds timeseries x-axis from inline rows shaped { [xKey]: <unix-seconds timestamp>, [seriesKey]: <number>, ... }. Only the FIRST series entry is rendered; multi-series, per-series area fills, and categorical (string) x-axis labels are NOT supported here (reserved for a dedicated chart ticket). Series colour is auto-assigned from the site's themed palette or can be overridden via `color` (hex or CSS var) or a brand `tone`; `palette` recolours the series. GUARDRAIL: prefer `palette` over per-series `color`, prefer `"var(--secondary)"` over frozen hex (CSS vars inherit white-label/theme overrides). LAYOUT: full-width row recommended; may share a 2-column Grid for direct comparison. - MSBarChart: { title?: string, xKey: string, period?: "TODAY" | "YESTERDAY" | "WTD" | "WTDMTS" | "LAST30" | "MTD" | "CURRENTMONTH" | "LASTMONTH" | "CURRENTQ" | "LASTQ" | "LAST12" | "YTD" | "CURRENTYEAR" | "CUSTOM", palette?: "categorical" | "ranked" | "warm" | "cool" | "semantic", chartHeight?: number, hideLegend?: boolean, interval?: "year" | "quarter" | "month" | "week" | "day" | "hour", series: Array<{ key: string, label: string, tone?: "default" | "primary" | "secondary" | "info" | "success" | "warning" | "danger" | "muted", color?: string }>, data: Array<Record<string, number | string | unknown>> } - MerchantSpring bar chart. Plots one or more metric series as stacked bars over a shared x axis from inline rows shaped { [xKey]: <unix-seconds timestamp>, [seriesKey]: <number>, ... }. Bars are always stacked; grouped (side-by-side) bars are not supported. A series may override its colour via `color` (hex or CSS var) or a brand `tone`; `palette` recolours the whole chart. `interval` sets tick granularity (year/quarter/month/week/day/hour). `chartHeight` fixes the pixel height; `hideLegend` removes the legend. GUARDRAIL: prefer `palette` over per-series `color`, prefer `"var(--secondary)"` over frozen hex. LAYOUT: full-width row recommended; may share a 2-column Grid for direct comparison. - MSStatCard: { label: string, value: string, delta?: string, deltaDir?: "up" | "down" | "neutral", tone?: "default" | "primary" | "secondary" | "info" | "success" | "warning" | "danger" | "muted", emphasis?: "plain" | "outlined" | "elevated" | "filled", icon?: "trending-up" | "trending-down" | "dollar-sign" | "shopping-cart" | "package" | "users" | "star" | "activity" | "bar-chart" | "percent" | "eye" | "alert-triangle", subtitle?: string, reverseDirection?: boolean } - MerchantSpring KPI tile: a large brand-coloured value with an uppercase label and optional delta. Place several inside a Grid (columns 3-4) to form a KPI row. `tone` colours the value + left accent; `emphasis` sets the frame (plain/outlined/elevated/filled). `icon` adds a lucide icon beside the value (e.g. `"trending-up"`). `subtitle` shows a small muted line beneath the value. `reverseDirection` inverts delta colour semantics: `"down"` renders green and `"up"` renders red — for cost metrics like ACoS/returns where a decrease is good. LAYOUT: compact widget — avoid full-width; place in a Grid of 2–4 total columns (3 recommended). - MSStatSummary: { title: string, subtitle?: string, columns?: number, badge?: string, tooltip?: string, stats: Array<{ label: string, value: string, unit?: string, tooltip?: string, delta?: string, deltaDir?: "up" | "down" | "neutral" }> } - MerchantSpring stat-summary card: a titled card (a `title` plus an optional `subtitle`, typically the reporting period) wrapping a responsive grid of KPI stats. Each stat has a `label`, an optional info `tooltip`, a large brand-coloured `value` with an optional `unit` suffix (e.g. "USD" or "%"), and an optional `delta` shown with an up/down arrow coloured green (up), red (down) or grey (neutral). This is the PREFERRED way to present a group of related KPIs at the top of a report — use it INSTEAD of a Grid of separate stat tiles. `columns` (1-3, default 2) sets the max columns and collapses to fewer as the card narrows. `value`, `unit` and `delta` are pre-formatted strings; omit the +/- sign on `delta` because the arrow already conveys direction. `badge` adds a status pill next to the title; `tooltip` shows an info hover tip. LAYOUT: full-width row recommended; may share a 2-column Grid for direct comparison. - MSReportHeader: { title: string, currency?: string, timezone?: string, fromDate?: string, toDate?: string, priorFromDate?: string, priorToDate?: string, stores?: Array<string> } - MerchantSpring report header: the branded cover block at the TOP of a report (logo, report title, reporting period, comparison period, currency, timezone, and the stores covered). Always make it the FIRST element of a report. Every field describes the report YOU are generating — set them from the report's own scenario, never from any UI state. `title` is the report name. `currency` is the ISO code to show (e.g. "USD"). `timezone` is an IANA name (e.g. "Australia/Sydney"). `fromDate`/`toDate` are the current reporting period and `priorFromDate`/`priorToDate` the comparison period, each an ISO date (YYYY-MM-DD). `stores` lists the names of the stores the report covers. The "generated on" date is stamped automatically — do NOT provide it. LAYOUT: use as a full-width row; never share a multi-column Grid. - MSPieChart: { title?: string, palette?: "categorical" | "ranked" | "warm" | "cool" | "semantic", legendStyle?: "plain" | "stat" | "marketplace", valueFormat?: "number" | "currency" | "percent", currency?: string, maxSlices?: number, legendLayout?: "row" | "column", condensed?: boolean, legendTitle?: string, slices: Array<{ label: string, value: number, percentage?: number, tone?: "default" | "primary" | "secondary" | "info" | "success" | "warning" | "danger" | "muted", color?: string, countryCode?: string, market?: string }> } - MerchantSpring pie chart. Shows share-of-total across categorical slices from inline `slices` rows { label, value, ... }. Colours auto-assign from the brand palette by slice order; `palette` picks the ramp: `categorical` (distinct hues, default), `ranked` (blue ramp), `warm`, `cool`, or `semantic` (green/red/orange/blue). A slice may override with a `tone` or a direct `color` (hex or CSS var). `legendStyle` selects plain / value+percent (`stat`) / marketplace country-flag rows. `legendLayout` `"column"` stacks the legend vertically. `condensed` shrinks legend items. `legendTitle` adds a heading above the legend. Percentages are computed automatically when omitted. LAYOUT: full-width row recommended; may share a 2-column Grid for direct comparison. - MSComboChart: { title?: string, xKey: string, period?: "TODAY" | "YESTERDAY" | "WTD" | "WTDMTS" | "LAST30" | "MTD" | "CURRENTMONTH" | "LASTMONTH" | "CURRENTQ" | "LASTQ" | "LAST12" | "YTD" | "CURRENTYEAR" | "CUSTOM", currency?: string, palette?: "categorical" | "ranked" | "warm" | "cool" | "semantic", interval?: "year" | "quarter" | "month" | "week" | "day" | "hour", lineUnit?: string, lineCanContainNegativeValues?: boolean, bar: { key: string, tone?: "default" | "primary" | "secondary" | "info" | "success" | "warning" | "danger" | "muted", color?: string, notCurrency?: boolean }, lines: Array<{ key: string, tone?: "default" | "primary" | "secondary" | "info" | "success" | "warning" | "danger" | "muted", color?: string, notCurrency?: boolean }>, data: Array<Record<string, number | string | unknown>> } - MerchantSpring combo chart: a bar series plus 1-2 lines over a shared numeric unix-seconds timeseries x-axis, on a DUAL y-axis (bars left, lines right). Use to overlay a volume metric (bars, e.g. sales / ad-spend) against a rate or ratio metric (line, e.g. conversion %, ACoS, growth %). Inline rows shaped { [xKey]: <unix-seconds timestamp>, [barKey]: <number>, [lineKey]: <number>, ... }. Each series legend label renders from its metric `key` via the `chartKey.<key>` translation, so use canonical MS metric keys (e.g. `sales`, `adSpend`, `unitsSold`, `acos`). `lineUnit` (e.g. "%") suffixes the right axis and pins it to a fixed scale; set `lineCanContainNegativeValues` for growth/delta lines that dip below zero. `notCurrency` on a series drops its currency symbol (auto-dropped when the key contains "units"). `interval` sets tick granularity (year/quarter/month/week/day/hour). Colour cascade per series: `color` (hex or CSS var) wins, then a brand `tone`, else the themed palette by order; `palette` recolours the whole chart. GUARDRAIL: prefer `palette` over per-series `color`, prefer "var(--secondary)" over frozen hex. LAYOUT: full-width row recommended; may share a 2-column Grid for direct comparison. - MSHorizontalBarChart: { title?: string, showPercent?: boolean, palette?: "categorical" | "ranked" | "warm" | "cool" | "semantic", bars: Array<{ label: string, value: number, tone?: "default" | "primary" | "secondary" | "info" | "success" | "warning" | "danger" | "muted", color?: string }> } - MerchantSpring horizontal bar chart: ranked categorical bars (one per category) drawn left-to-right, with the value (and optional share %) labelled at each bar end. Use for top-N rankings — best-selling products, marketplaces by sales, suppressed-listing counts. This is CATEGORICAL: there is NO date/time axis. `bars` is an inline array { label, value, tone?, color? } in the order to display (sort descending for a ranking). `showPercent` appends each bar's share of the total. Colour cascade per bar: `color` (hex or CSS var) wins, then a brand `tone`, else the themed palette by order; `palette` recolours all bars. GUARDRAIL: prefer `palette`/`tone` over frozen hex; prefer "var(--secondary)". LAYOUT: full-width row recommended; may share a 2-column Grid for direct comparison. - MSScatterChart: { period?: "day" | "week" | "month", data: Array<{ time: number, metric: number }> } - MerchantSpring scatter/trend chart, specialised for the platform's Buy Box win-rate trend view. It plots a SINGLE 0–100% metric as connected points over a recent time window and renders a FIXED platform heading (a "Buy Box" 1-day / 7-day / 30-day title) and a FIXED 0–100% y-axis — neither the title nor the axis is customisable, so use this ONLY for a percentage metric tracked over time (e.g. Buy Box win rate); for any other metric or a free y-axis use MSLineChart instead. `period` selects the window and x-axis granularity: `day` (last 24h, hourly ticks), `week` (last 7 days, weekday ticks), or `month` (last 30 days, default). `data` is inline rows { time: <unix-seconds timestamp that MUST fall within the selected window ending now>, metric: <number 0–100, a percentage> }. Point colour is the brand primary and is not overridable. Wrap it in a Card to give it your own surrounding title. LAYOUT: full-width row recommended; may share a 2-column Grid for direct comparison. - MSHorizontalStackedBarChart: { title?: string, palette?: "categorical" | "ranked" | "warm" | "cool" | "semantic", view?: "units" | "currency" | "percentage", barLabelsKey: string, currency?: string, segments: Array<{ key: string, label: string, tone?: "default" | "primary" | "secondary" | "info" | "success" | "warning" | "danger" | "muted", color?: string, toFixed?: number }>, data: Array<Record<string, number | string | unknown>> } - MerchantSpring horizontal stacked bar chart: each category row (keyed by `barLabelsKey`) stacks several segments left-to-right to a total. Use for part-to-whole comparisons across categories — sales by channel split by marketplace, orders by status, spend by campaign type. This is CATEGORICAL (no date axis). Inline `data` rows shaped { [barLabelsKey]: <category label>, [segmentKey]: <number>, ... }; `segments` lists the stacked fields { key, label, tone?, color?, toFixed? } in stack order. `view` sets value formatting and the axis: `currency` (default — uses the report currency), `units`, or `percentage`. Each segment legend label renders from its `label` via the `chartKey.<label>` translation. Colour cascade per segment: `color` (hex or CSS var) wins, then a brand `tone`, else the themed palette by order; `palette` recolours the stack. GUARDRAIL: prefer `palette`/`tone` over frozen hex; prefer "var(--secondary)". LAYOUT: full-width row recommended; may share a 2-column Grid for direct comparison. - MSDonutChart: { variant: "percent" | "segments", title?: string, percent?: number, segments?: Array<{ label: string, value: number, tone?: "default" | "primary" | "secondary" | "info" | "success" | "warning" | "danger" | "muted", color?: string }> } - MerchantSpring donut chart. Two shapes selected by `variant`: `percent` draws a single progress ring filled to `percent` (0-100) with a centred percentage label, auto-coloured by a red→amber→green health ramp — use it for a score / completion / health gauge (the `segments` field is ignored). `segments` draws a labelled share-of-total ring from inline `segments` rows { label, value } with an external legend — use it for a category breakdown (the `percent` field is ignored). Segment colours auto-assign from the brand palette by order; a segment may override with a brand `tone` or a direct `color` (hex or CSS var). GUARDRAIL: prefer a named `tone` over a raw `color`, and `"var(--secondary)"` over frozen hex (CSS vars inherit white-label/theme overrides). LAYOUT: full-width row recommended; may share a 2-column Grid for direct comparison. - MSGaugeChart: { title?: string, value: number, bands: Array<{ label?: string, value: number, tone?: "default" | "primary" | "secondary" | "info" | "success" | "warning" | "danger" | "muted", color?: string }>, needleTone?: "default" | "primary" | "secondary" | "info" | "success" | "warning" | "danger" | "muted", needleColor?: string } - MerchantSpring gauge chart (a half-donut with a needle). Plots a single `value` as a needle pointing across coloured `bands` that segment the arc left→right (e.g. poor / ok / good thresholds). Each band is { value } — its arc width — with an optional `label`; the needle rests at `value` measured along the summed total of all band values, so size the bands in the same units as `value`. Band colours default to a green→amber→red ramp and can be overridden per band with a brand `tone` or `color`. `needleTone`/`needleColor` recolour the needle. Use for a single KPI-against-target gauge (budget pacing, a health score). GUARDRAIL: prefer a named `tone` over raw `color`. LAYOUT: full-width row recommended; may share a 2-column Grid for direct comparison. - MSFunnelChart: { title?: string, isCurrency?: boolean, currency?: string, stages: Array<{ name: string, value: number, percentage?: number, conversionChange?: number, marketShare?: number, marketShareChange?: number, tone?: "default" | "primary" | "secondary" | "info" | "success" | "warning" | "danger" | "muted", color?: string }> } - MerchantSpring funnel chart. Shows a multi-stage conversion funnel from inline `stages` rows { name, value } in order (e.g. Impressions → Clicks → Add-to-cart → Purchases), each drawn as a tapering bar with a metrics header and a tooltip. `percentage` (each stage's share of the FIRST stage) is computed automatically when omitted. Optional per-stage `conversionChange` (period-over-period delta) and `marketShare`/`marketShareChange` drive the change badges. Set `isCurrency` true (with an optional ISO `currency` like "USD") when the values are monetary so they format as money; otherwise they show as plain counts. Stage fill auto-assigns the brand secondary; override per stage with a brand `tone` or a direct `color`. GUARDRAIL: prefer a named `tone` over raw `color`. LAYOUT: use as a full-width row; never share a multi-column Grid. - MSStepChart: { title?: string, currency?: string, compact?: boolean, data: Array<{ timestamp: number, sales: number, average: number }> } - MerchantSpring step chart: a week-to-date cumulative sales chart. It draws two stepped bar series per weekday — actual cumulative `sales` to date (solid brand secondary) layered with expected/typical cumulative sales `average` (light brand secondary) — over a weekday x-axis. `data` is inline rows { timestamp: <unix-seconds, rendered as a weekday Mon–Sun>, sales: <cumulative actual sales>, average: <cumulative expected sales> }; `sales`/`average` are currency amounts in `currency` (an ISO code, defaults to the site currency) and the y-axis is labelled with that currency's symbol. `compact` shrinks the chart for tight layouts. Series colours are the fixed brand palette and are not overridable. `title` renders a small heading above the chart. If every row's `average` is 0 the chart shows a no-data state. LAYOUT: compact widget — avoid full-width; place in a Grid of 2–3 total columns (3 recommended). - MSProgressBar: { variant: "percent", label?: string, percent: number, tone?: "default" | "primary" | "secondary" | "info" | "success" | "warning" | "danger" | "muted", color?: string, barHeight?: number } | { variant: "fraction", label?: string, numerator: number, denominator: number, tone?: "default" | "primary" | "secondary" | "info" | "success" | "warning" | "danger" | "muted", color?: string, barHeight?: number } - MerchantSpring progress bar: a thin labelled bar filled to a percentage. Two shapes selected by `variant`: `percent` fills to `percent` (0-100) and labels the bar with the percentage; `fraction` fills to `numerator`/`denominator` and labels the bar with the raw fraction (e.g. 7/10). `label` is the heading shown above the bar. The filled portion defaults to the brand primary; override it with a brand `tone` or a direct `color` (hex or CSS var). `barHeight` sets the bar's pixel thickness (defaults to a thin bar). Use for a single completion / quality / pacing metric. GUARDRAIL: prefer a named `tone` over raw `color`, and `"var(--secondary)"` over frozen hex. LAYOUT: full-width row recommended; may share a 2-column Grid for direct comparison. AVAILABLE ACTIONS: - setState: Update a value in the state model at the given statePath. Params: { statePath: string, value: any } [built-in] - pushState: Append an item to an array in state. Params: { statePath: string, value: any, clearStatePath?: string }. Value can contain {"$state":"/path"} refs and "$id" for auto IDs. [built-in] - removeState: Remove an item from an array in state by index. Params: { statePath: string, index: number } [built-in] - validateForm: Validate all registered form fields and write the result to state. Params: { statePath?: string }. Defaults to /formValidation. Result: { valid: boolean, errors: Record<string, string[]> }. [built-in]
render-ui
Update an existing custom group's name, products, or brands. What it does: Atomically renames a group and/or adds/removes its members. Operations are additive/subtractive — never a full replacement, so unlisted members are unchanged. Product groups and brand groups are mutually exclusive: passing product operations on a brand group (or vice versa) is rejected by the upstream service. Retrieve the groupId from getCustomGroups first. When to use this tool — example user queries: - "add SKU X and Y to my Summer Products group" - "remove SKU Z from the group" - "rename group 'Old Name' to 'New Name'" - "add brand Nike to the Sports Brands group and remove Puma" Routing & params: - channelId, merchantId: required — use getChannels tool first to retrieve valid values. - groupId: required integer — from getCustomGroups. - groupName: optional new name for the group. - addProducts / removeProducts: lists of {sellerSku} for product groups only. - addBrands / removeBrands: lists of brand strings for brand groups only. - At least one field must be provided. Mixing product and brand ops in one call is rejected. - confirm: omit on the first call; re-call with confirm: true to proceed.
updateGroup
 Recommended guideHow to get your ChatGPT Plugin suggestedFollow the practical steps agents use to find, shortlist, and choose your Plugin.Read guide
MerchantSpring ChatGPT Plugin FAQ
How the directory, categories and Discoverability Score work.
Read the methodologyHow do I improve MerchantSpring's ChatGPT Plugin discoverability?
The levers are the listing surface agents actually read: names, descriptions, keywords, tool metadata, and registry health. Which lever matters depends on where discovery breaks, which is what continuous measurement shows.
Where is this profile measured?
This profile uses the geography attached to the latest public registry snapshot: US. Locale tags are intentionally omitted.