Charts by Szum
Turn data into polished charts
- Category
- Data & Analytics
- Primary Subcategory
- Self-Serve BI & Conversational Analytics
 View in the Claude registry
Integration details
Description
After connecting, start a new chat and say: "Use Charts by Szum to create an editorial bar chart from this data: North 42, South 35, East 28, West 31.". Charts by Szum helps Claude turn plain-language requests and raw data into publication-ready charts. It can explore curated themes and examples, validate the chart definition, and display an interactive preview with an SVG or PNG image link. When you want to keep a result, save it for permanent image and interactive embed links, then reopen, update, rename, or delete it from Claude or Szum Studio. Useful for reports, presentations, product work, and dashboards.
- Integration type
- Connector
- Verification status
 Community connector
- Platform
- Claude
- Primary Subcategory
- Self-Serve BI & Conversational Analytics
- Secondary Subcategories
- None listed
- Brand
- Szum
- Access
- No account required
- First tracked
- 2026-07-20
- Tool count
- 12
- Geography
- US
The Primary Subcategory used for this profile’s headline score.
Other Subcategories where the Integration is listed.
Claude Discoverability Score
Claude Connector discovery is coming soon
Community Connectors only appear in Claude’s registry.Once verified, organic discovery begins and we can calculate your score.Read more about Community Connector verification.
No spam. Unsubscribe any time.
No spam. Unsubscribe any time.
What discovery looks like
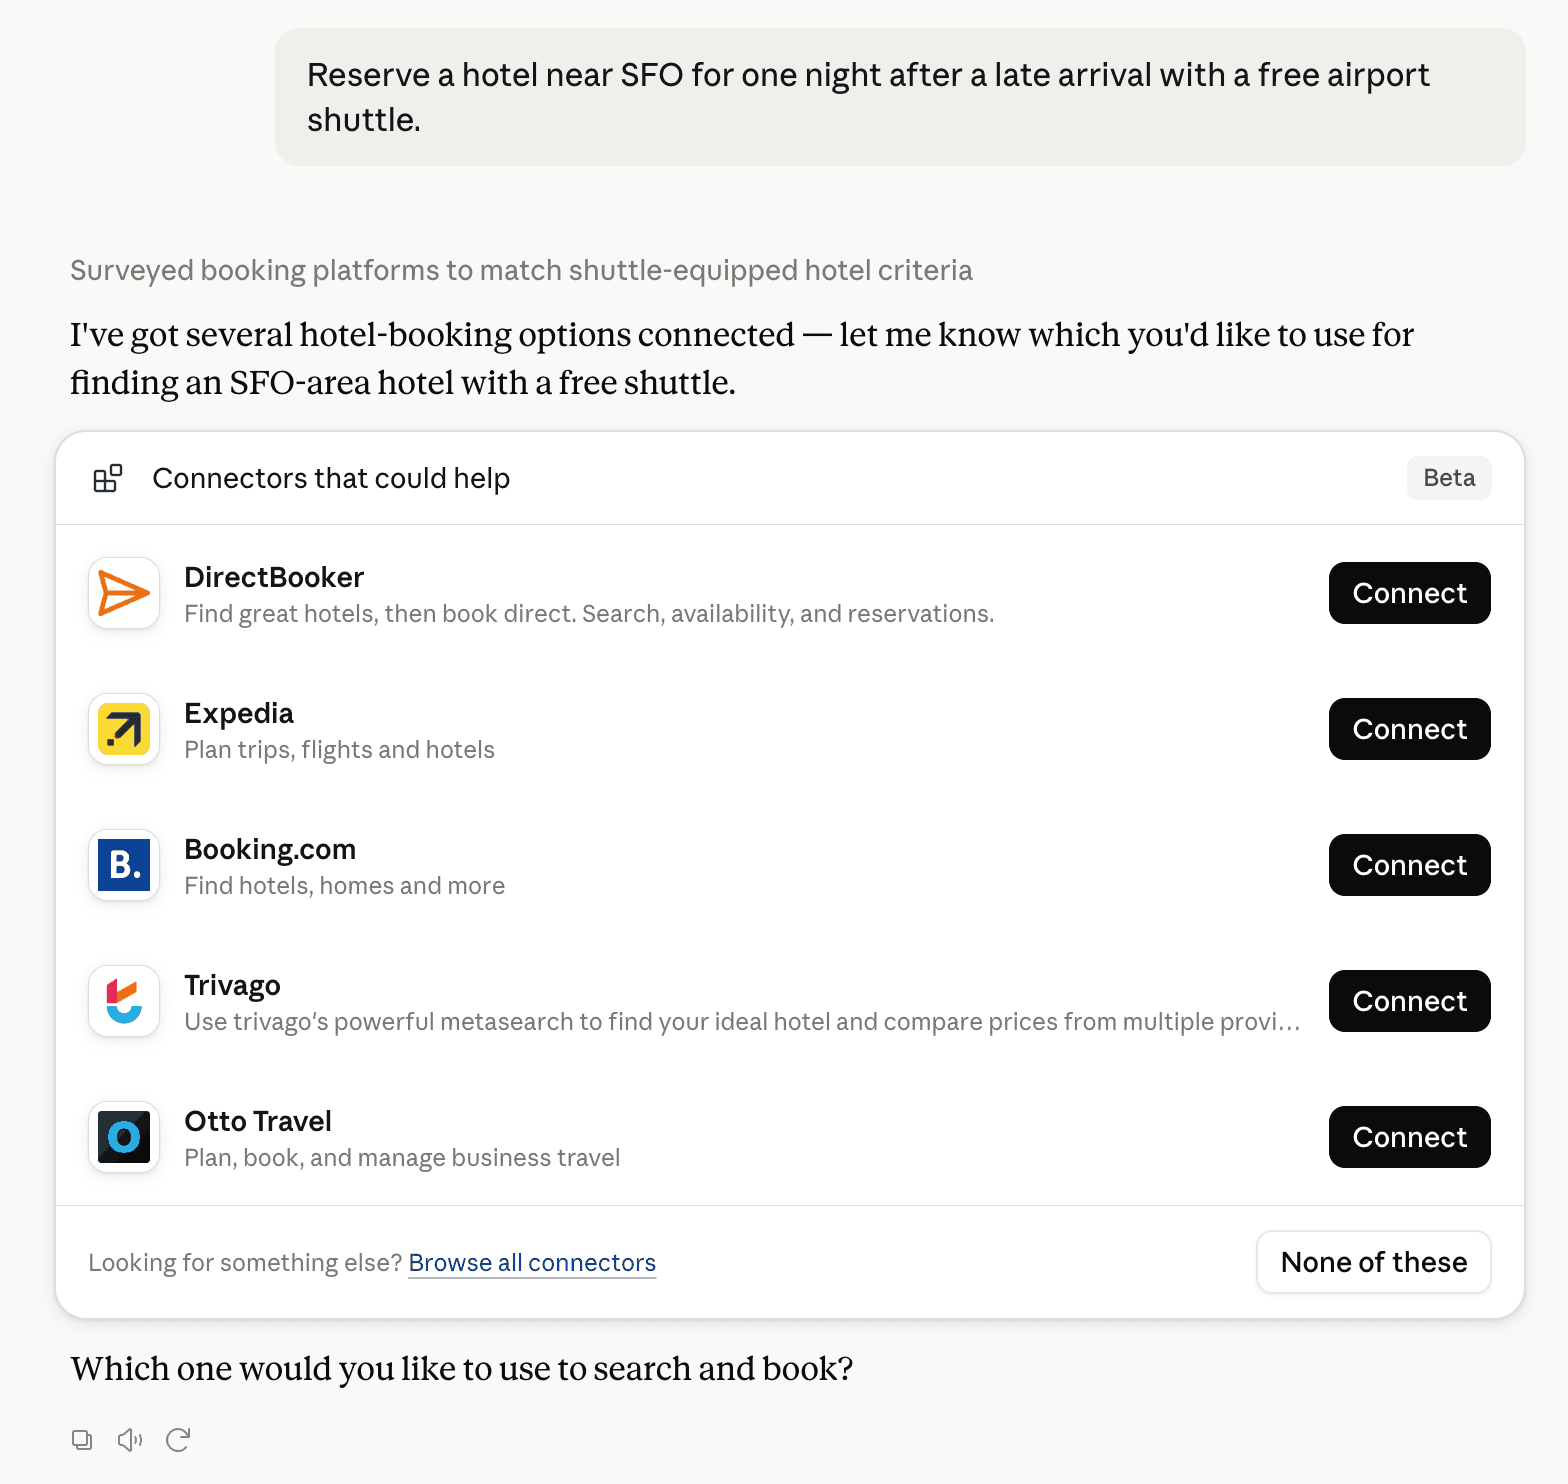
Claude can surface verified Connectors when they match a user’s Prompt.
How Claude Connector discovery works
Your Connector will compete to appear for users’ Prompts once Claude verifies it
Competing in Claude Self-Serve BI & Conversational Analytics
View Category
12 tools agents can invoke
How do I improve a Community connector's discoverability?
The levers are the listing surface agents actually read: names, descriptions, keywords, tool metadata, and registry health. Which lever matters depends on where discovery breaks, which is what continuous measurement shows.
What are Charts by Szum alternatives on Claude?
As of 2026-09-12, Charts by Szum competes with Omni Analytics, Polar Analytics, Google Cloud BigQuery, dbt, Amplitude, Mixpanel, Snowflake, Supermetrics Marketing Analytics, Adobe Customer Journey Analytics, PostHog, Supabase, Aleph, Fullstory, Funnel, Datadog, DataHub, ChartMogul, Metabase, Flourish, Gainsight (Customer Communities), Hex, Orion by Gravity, Sigma, ThoughtSpot Spotter, Basedash, BEEM, Blaze SQL, Bloom Profit Analytics, BOCP - Business Online Control Panel, Cayra MCP, contextflo, Credible, Cube, Databox, Evidence Studio, Geckoboard, Jenner Analytics, Juicy attribution & profit, Loam Data, Margins, mcp.adeci.pt, mcp.hologrow.ai, New Vintage, Notehub, Omnivio Lens, OWOX Data Marts, Pagos, Protobi Claude MCP, Rill, Signara, Sprucely.io, Steep, Supernova, Tableau Cloud, Triple Whale, TrueGradient, Upsolve AI, Windsor.ai for Web Analytics, WitCloud, Wren AI, YourBI in Claude Self-Serve BI & Conversational Analytics, ranked by public Discoverability Score.
Where is this profile measured?
This profile uses the geography attached to the latest public registry snapshot: US. Locale tags are intentionally omitted.