
Stackpulse
Your whole stack in one place: the vendors you depend on and your own sites and APIs, so Claude can tell whether a problem is yours or theirs, and which vendors let you down most.
 View in the Claude registry
- Brand
- Stackpulse
- Category
- Developer Tools
- Primary Subcategory
- Observability, Monitoring & Incident Response
Integration details
Description
Stackpulse puts the services your product depends on (out of 9,700+ official status pages: AWS, Cloudflare, Stripe, Twilio, GitHub…) on one dashboard with your own websites and API endpoints, checked every minute. This connector gives Claude that dashboard and its history, so it can answer the questions a single status page can't. Things to ask: - "Is anything on my stack down right now?" Every vendor and URL on your dashboards, problems first. - "Our API got slow around 3 pm. Is it us or one of our vendors?" Your URL monitor's checks beside your vendors' problems from that time. - "What went wrong on our stack this week?" Every incident across your vendors and URLs, with what else broke at the same time. - "Which of our vendors was least reliable this quarter?" Time with problems by severity, incidents and recovery for each, and which vendors tend to break together. - "How has our checkout endpoint done this month?" Uptime, response times, failed checks and its certificate. - "Add Twilio and Postmark to our Production dashboard and watch api.example.com." With Read & write access it can also create and rename dashboards, add or remove services, add URL monitors, run a check now, and pause or resume one. The only removal is taking services off a dashboard. Any of the 9,700+ services can be looked up too, dashboard or not. You need a Stackpulse account on Pro ($39 a month; every new account gets a 14-day trial, no card). You sign in with Stackpulse, the connection starts read-only and asks again before it may change anything, and you can limit it to some dashboards. Disconnect any time in Settings → API & MCP.
- Integration type
- Connector
- Verification status
 Community connector
- Platform
- Claude
- Primary Subcategory
- Observability, Monitoring & Incident Response
- Secondary Subcategories
- None listed
- Brand
- Stackpulse
- Access
- No account required
- First tracked
- 2026-10-11
- Tool count
- 16
- Market
- US
The Primary Subcategory used for this profile’s headline score.
Other Subcategories where the Integration is listed.
 Agent DiscoverabilityClaude Discoverability Score
Claude Connector discovery is coming soon
Community Connectors only appear in Claude’s registry.Once verified, organic discovery begins and we can calculate your score.Read more about Community Connector verification.
No spam. Unsubscribe any time.
What discovery looks like
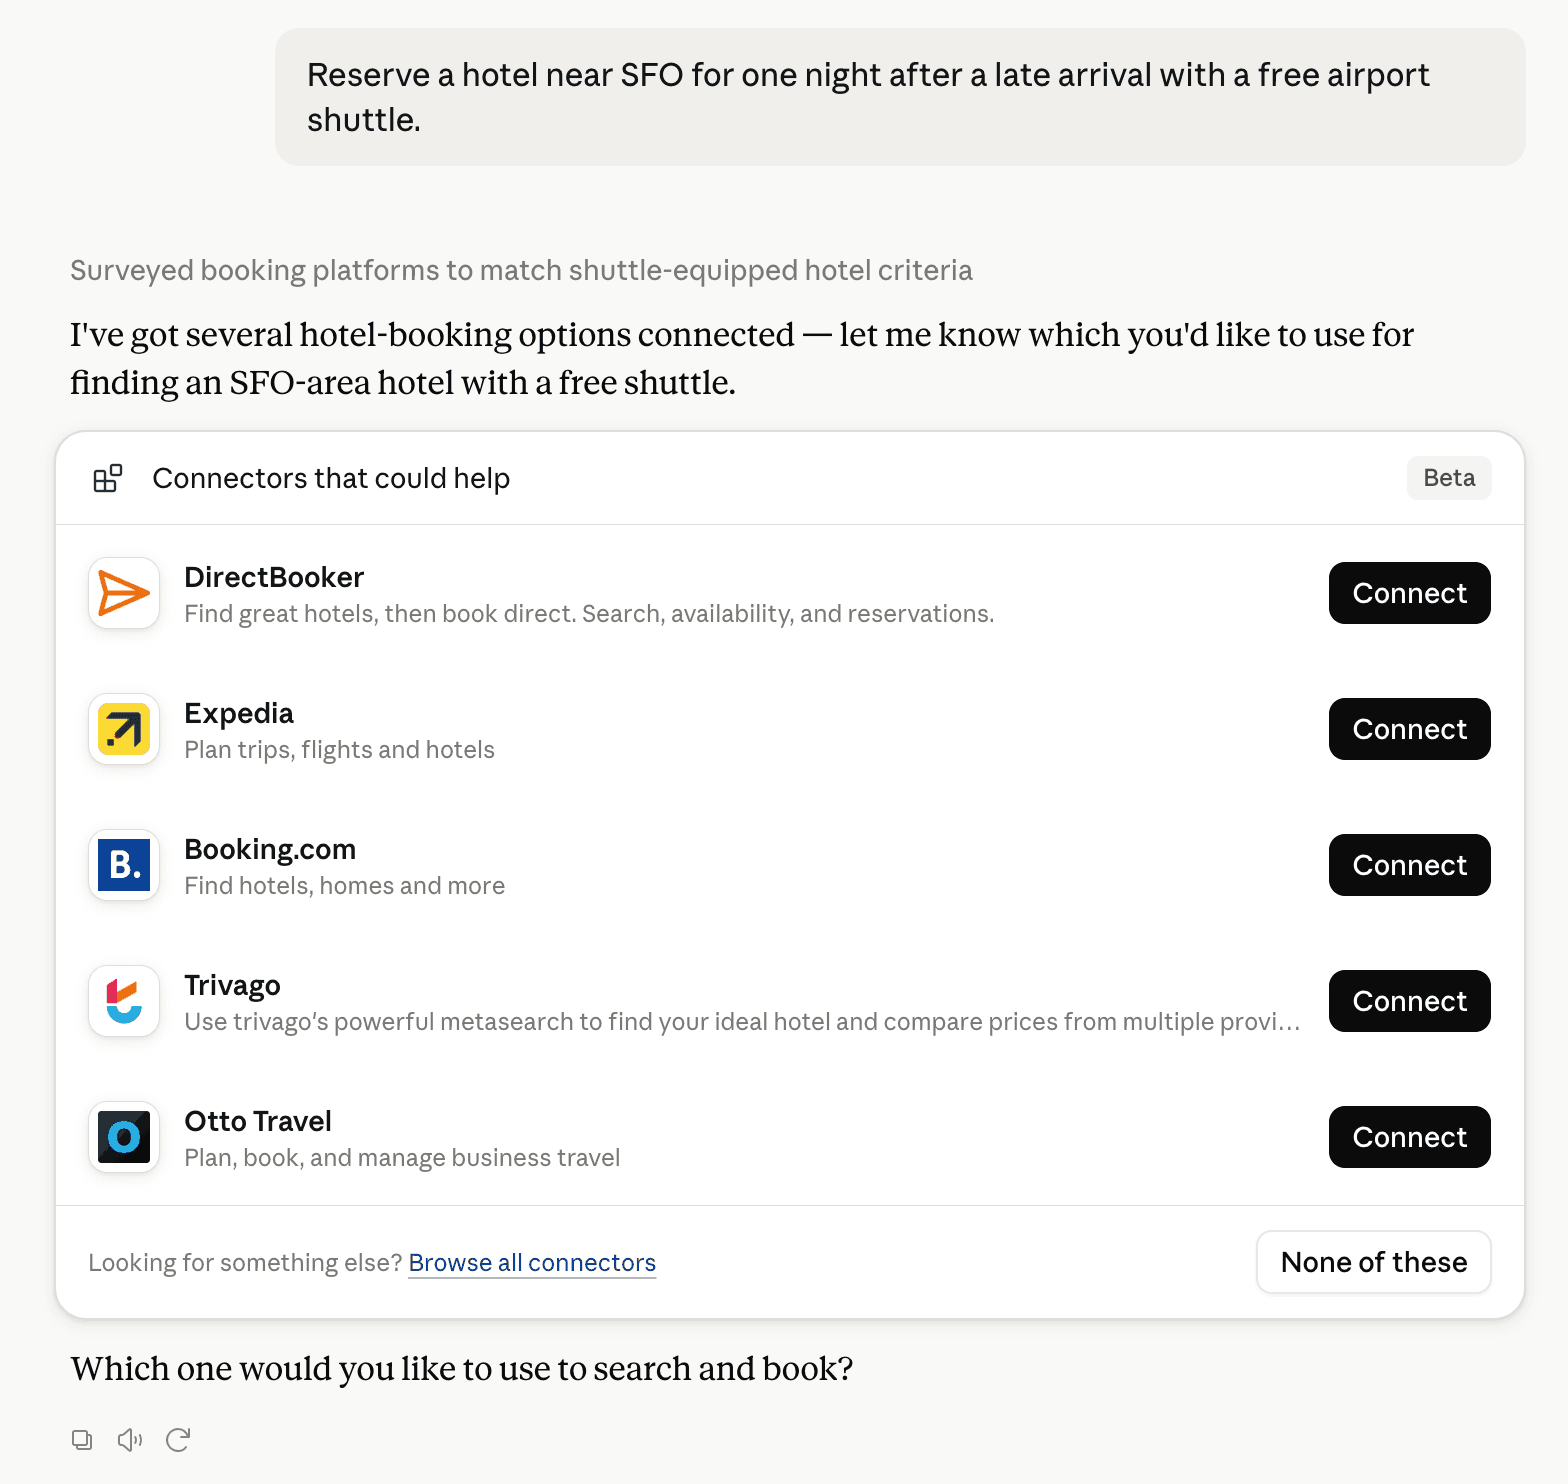
Claude can surface verified Connectors when they match a user’s Prompt.
How Claude Connector discovery works
Your Connector will compete to appear for users’ Prompts once Claude verifies it
Competing in Claude Observability, Monitoring & Incident Response
View Category
16 tools agents can invoke

Stackpulse Claude Connector FAQ
How the directory, categories and Discoverability Score work.
Read the methodologyHow do I improve Stackpulse's Claude Connector discoverability?
The levers are the listing surface agents actually read: names, descriptions, keywords, tool metadata, and registry health. Which lever matters depends on where discovery breaks, which is what continuous measurement shows.
What are Stackpulse alternatives on Claude?
As of 2026-10-28, Stackpulse competes with Datadog, incident.io, Coralogix, PagerDuty, Grafana Cloud, Bronto, Sentry, Vercel and 74 more in Claude Observability, Monitoring & Incident Response, ranked by public Discoverability Score.
Where is this profile measured?
This profile uses the geography attached to the latest public registry snapshot: US. Locale tags are intentionally omitted.