
Meiku Charts
Turn a table into an animated chart or a live, sortable table, and get an embed code you can paste into any web page.
 View in the Claude registry
- Brand
- Meiku Charts
- Category
- Data & Analytics
- Primary Subcategory
- Self-Serve BI & Conversational Analytics
Integration details
Description
Meiku Charts turns the numbers in your conversation into charts and tables you can publish. Paste a table or describe your data, and Claude can: - suggest the chart that fits the data, with a short reason; - build a live chart or table and return an embed code for your website, blog or docs; - render the chart as an SVG image; - prepare messy tables, keeping notes and status labels such as Yes, No and Partly. There are 24 chart types, including bar, line, donut, waterfall, heatmap, Sankey and treemap, plus a live table that readers can sort, filter and turn into a chart. Five themes come in light and dark versions. Embeds animate when the data changes and work in WordPress and plain HTML pages. The connector only creates charts from data you provide. It does not read or change anything in your accounts. Sign in with Google to connect. The free plan includes 10 AI charts a month. Pro ($19 a month) includes 500, removes the "Made with Meiku Charts" credit and adds a local server for PNG export.
- Integration type
- Connector
- Verification status
 Community connector
- Platform
- Claude
- Primary Subcategory
- Self-Serve BI & Conversational Analytics
- Secondary Subcategories
- None listed
- Brand
- Meiku Charts
- Access
- Account required
- First tracked
- 2026-10-18
- Tool count
- 5
- Market
- US
The Primary Subcategory used for this profile’s headline score.
Other Subcategories where the Integration is listed.
 Agent DiscoverabilityClaude Discoverability Score
Claude Connector discovery is coming soon
Community Connectors only appear in Claude’s registry.Once verified, organic discovery begins and we can calculate your score.Read more about Community Connector verification.
No spam. Unsubscribe any time.
What discovery looks like
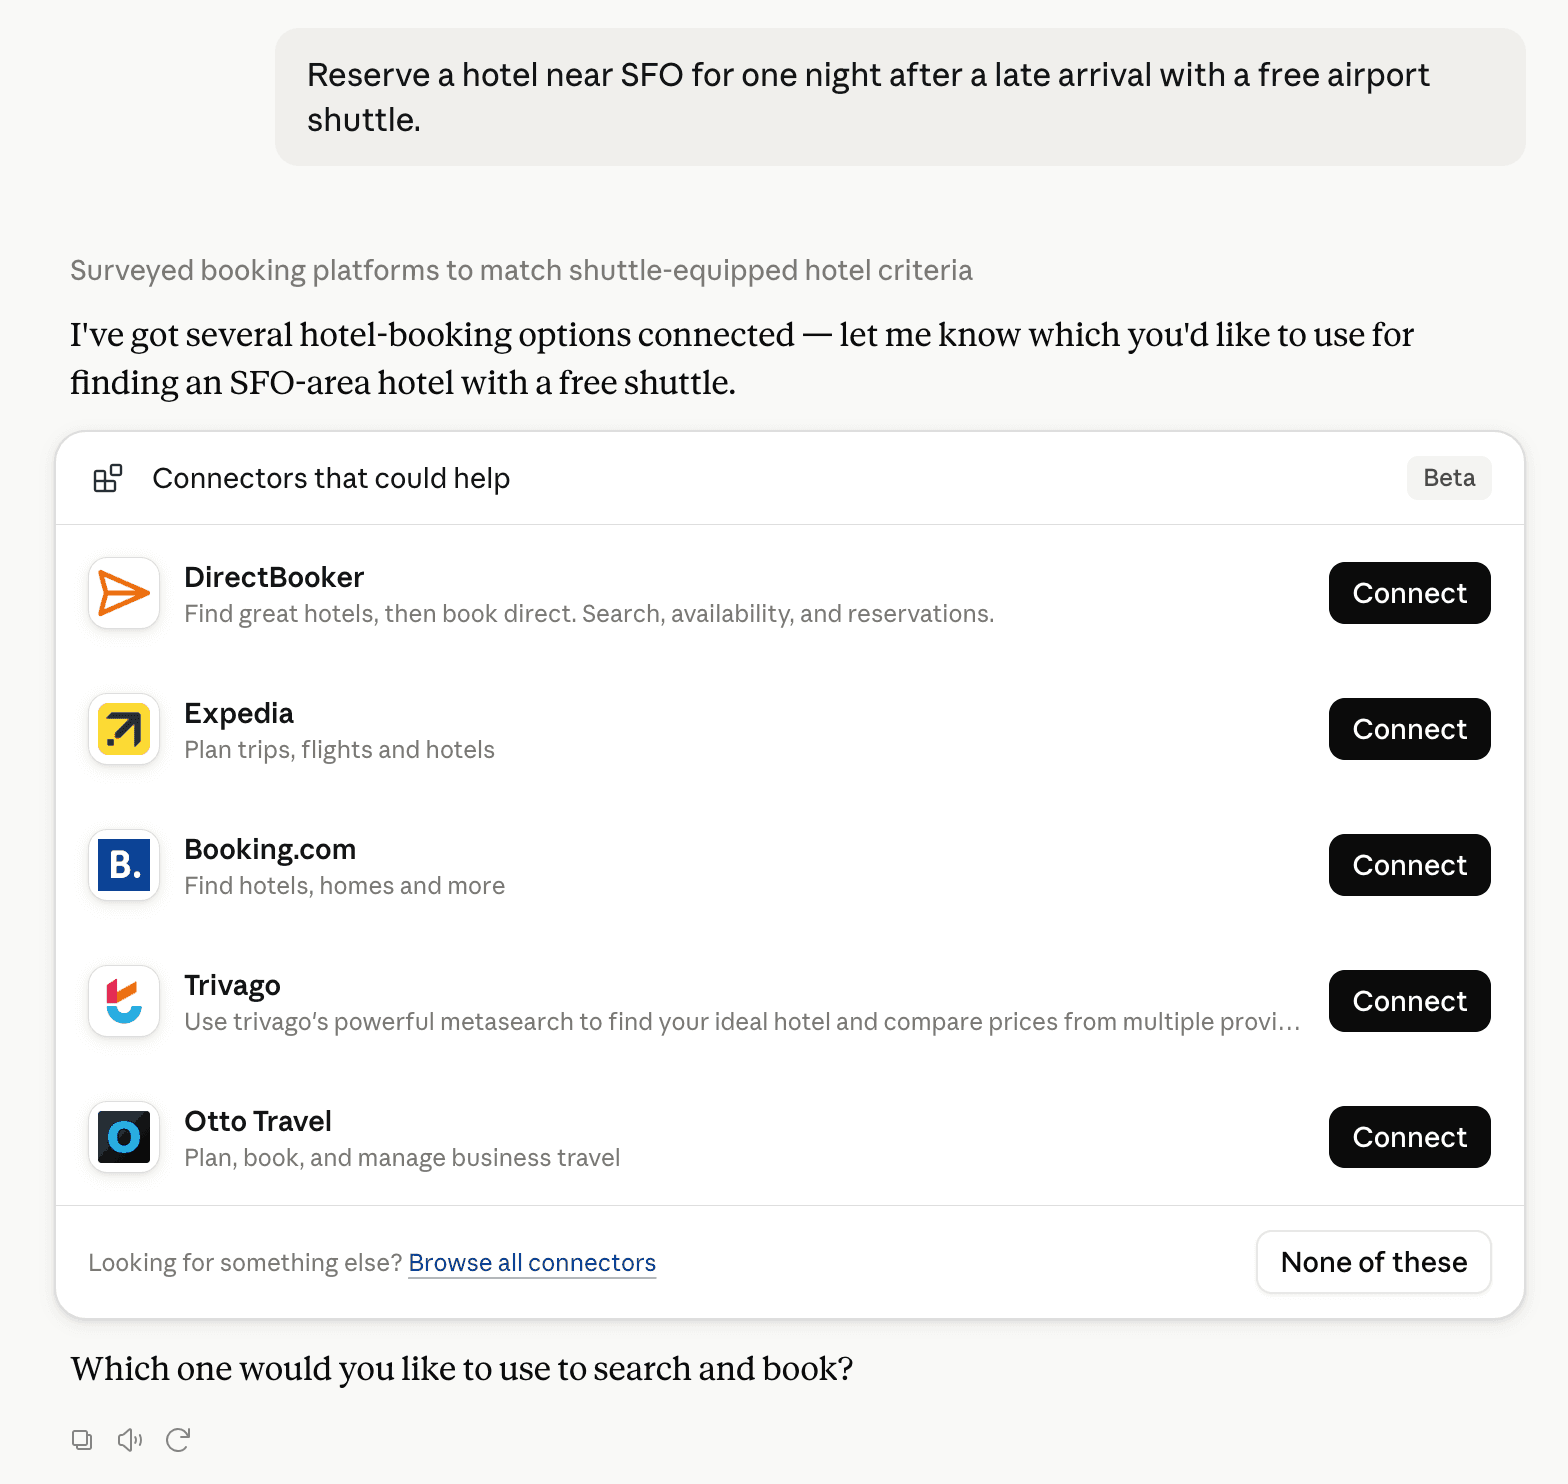
Claude can surface verified Connectors when they match a user’s Prompt.
How Claude Connector discovery works
Your Connector will compete to appear for users’ Prompts once Claude verifies it
Competing in Claude Self-Serve BI & Conversational Analytics
View Category5 tools agents can invoke

Meiku Charts Claude Connector FAQ
How the directory, categories and Discoverability Score work.
Read the methodologyHow do I improve Meiku Charts's Claude Connector discoverability?
The levers are the listing surface agents actually read: names, descriptions, keywords, tool metadata, and registry health. Which lever matters depends on where discovery breaks, which is what continuous measurement shows.
What are Meiku Charts alternatives on Claude?
As of 2026-10-30, Meiku Charts competes with Omni Analytics, Polar Analytics, Google Cloud BigQuery, Supermetrics Marketing Analytics, Adobe Customer Journey Analytics, Snowflake, Blaze SQL, DataHub and 135 more in Claude Self-Serve BI & Conversational Analytics, ranked by public Discoverability Score.
Where is this profile measured?
This profile uses the geography attached to the latest public registry snapshot: US. Locale tags are intentionally omitted.